

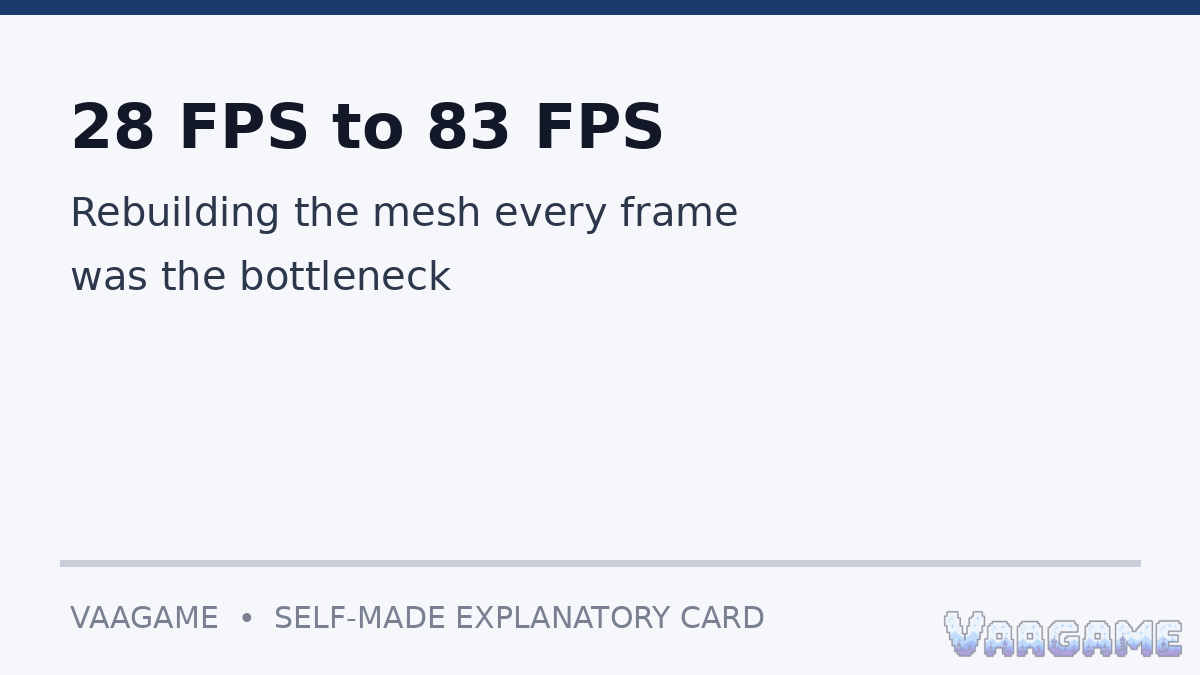
About 20 animated characters should not be enough to sink a frame rate. In one Godot demo scene, they were: the scene ran at 28 frames per second, and the biggest single cost was not drawing the picture. It was rebuilding it, every frame, from scratch. The fix did not change what the scene looked like. It changed how often the engine threw its work away.
Symptom: a demo scene with about 20 animated characters fell off in performance; the author measured a 35 ms frame.
Profile: Polygon2D notification took 15.7 ms and drawing took 11.7 ms, of which only about 3.4 ms was actually rendering.
Root cause: animating Polygon2D vertices caused the internal mesh to be rebuilt every frame, creating and freeing vertex arrays each time.
Fix: when the vertex count stays the same, update the vertex data on the existing mesh through Godot low-level API instead of recreating the mesh.
Re-measured: the frame fell from 35 ms to 13 ms, and the author demo went from 28 FPS to 83 FPS on the author device.
Second case: giving each shader-transpilation thread its own heap saved 11 seconds of load time in a TPS demo, as reported by the Godot team.
The game behind the numbers
The Polygon2D case started with a conversation, not a benchmark table. Aurélien Condomines, working on Heidi's Legacy: Mountains Calling, told the Godot team that the animation code felt very slow and limited how much content he could add. With about 20 animated characters on screen, performance started to fall off. That number is what made the author suspicious: animation code should not be the bottleneck with only about 20 characters, so something else had to be wrong.
The setup was unusual, and the article says so plainly. An AnimationPlayer animated the vertices of a Polygon2D, which was displayed on a Viewport on a Sprite3D, so that 2D animation could look right inside a 3D world. Unusual is not the same as broken: the author notes this alone should not cause significant problems. So the next step was not to rewrite the animation. It was to profile the demo scene and see where the time actually went. All testing of this demo scene, the article notes, was done on a Ryzen 5 9600X CPU.
A method before a fix
Optimizing CPU performance, in the author outline, runs in five steps: identify the bottlenecks, understand why the bottleneck is where it is, investigate solutions, re-measure performance, and repeat. The hardest step is the first one. Engine developers face thousands of moving targets rather than one game, and often learn about a serious problem only when someone files a bug report. The best tool for finding CPU bottlenecks, the article says, is a CPU profiler. Godot editor has two built in, one for GDScript code and one for the renderer, but engine-level C++ work needs an external profiler. The author tool of choice is Superluminal, an external sampling profiler that attaches to a running instance of Godot. Godot also supports building with Tracy for tracing profiling.
There is also a warning that belongs at the top of any optimization story. Performance is dictated by the slower of the CPU and the GPU, and no amount of CPU optimization will save inefficient shaders. Renderer work is full of tradeoffs: 2D batching hurts GPU performance a little but improves CPU performance a lot, which is usually a net win because 2D games tend to be CPU bottlenecked first, while Godot does occlusion culling on the CPU in 3D to take load off the GPU. And re-measure is not optional: the article gives examples where an intuitively faster change, such as adding a branch to skip calculations or caching a value, actually made things slower by blocking compiler vectorization or by trading cheap computation for expensive memory reads.
The symptom, measured
The demo scene frame took 35 ms. AnimationMixer took 4.6 ms, which the author calls slower than ideal but not unexpected given how many animation tracks the scene has, since every vertex is being animated. Polygon2D notification took 15.7 ms. Drawing the scene took 11.7 ms, and inside that figure, 3.3 ms went to creating vertex arrays and 5 ms went to freeing them, leaving only about 3.4 ms actually rendering the scene.
AnimationMixer: 4.6 ms, slower than ideal but expected with so many animation tracks.
Polygon2D notification: 15.7 ms, the largest single cost.
Drawing: 11.7 ms, of which creating vertex arrays took 3.3 ms and freeing them took 5 ms.
Actually rendering: only about 3.4 ms of the 11.7 ms drawing cost.
The root cause
Two things were immediately wrong: Polygon2D was doing something unexpected, and whatever it was, it was causing vertex arrays to be created and freed every frame. The timeline and the call graph pointed at the same place: most of the time went to adding a new surface and freeing the previous one. The code building Polygon2D internal mesh was running every frame, and it was very slow. Put together, the conclusion is almost obvious in hindsight: the mesh was being rebuilt every frame because the vertices were changing on the CPU every frame.
The fix, and the condition that makes it safe
Godot exposes a low-level API to manually update vertex data, and that is the lever the fix pulls. When the number of vertices in a mesh is going to stay the same, there is no need to free the old mesh, allocate a new one, and upload the vertex data to the new mesh. The data can simply be uploaded to the existing mesh. That is what the author pull request did.
Most of the work in the pull request, the author stresses, was not the upload itself. It was identifying which cases were suitable for updating the mesh and which cases still needed the mesh to be recreated. That distinction is the part that transfers to other code: an in-place update is only safe when the shape of the data has not changed, and the fix is a decision rule, not just a faster call. Applied blindly to a mesh whose vertex count changed, it would be wrong, which is why the article frames the work as case-splitting rather than as a one-line speedup.
Re-measured on the author device, a single frame went from 35 ms to 13 ms. Rendering now accounts for about 50 percent of frame time, animation for about 30 percent, and the Polygon2D update for about 20 percent. The author reports the headline result directly: the optimization roughly tripled the performance of animated Polygon2Ds, and the demo went from 28 FPS to 83 FPS on the author device. Note on reading the two pairs of numbers: the 35 to 13 ms figures describe a single captured frame, while the 28 to 83 FPS figures are the author reported demo result; they are not presented here as an arithmetic conversion of each other, since a single captured frame and a sustained frame-rate reading are different measurements.
The author is also honest about what was left undone. The fix still re-uploads the entire mesh data each frame that any vertex moves. A further optimization would update only the region of the mesh that changed, so an animation touching a few vertices would not pay for a full upload. That was not done, deliberately: this demo animates essentially every vertex every frame, so the tracking needed for partial updates would likely be a net negative. The lesson is stated as a rule: without a test case that would actually benefit, you cannot do an optimization properly.
Case two: when threads wait on memory
Earlier in the year, Asilkan investigated Godot shader compilation pipeline on the D3D12 backend. The pipeline runs in four steps: GDShader is compiled to GLSL with the built-in shader compiler, GLSL is compiled to SPIRV with GLSLang, SPIRV is transpiled to DXIL with Mesa NIR converter, and DXIL is submitted to the GPU driver to be compiled to binary. The transpilation step is by far the slowest part, and it creates a noticeable loading-time difference when switching from Vulkan, which can use SPIRV directly, to D3D12.
Profiling showed gaps where only a couple of threads were active. Zooming in, the gaps turned out to be threads requesting more memory from the operating system: although the work was heavily multithreaded, all threads ended up waiting on each other while waiting on the OS to allocate more heap memory from a single global heap. The fix was to give each thread its own heap and let it allocate from that instead of frequently asking the OS for more memory from the shared heap. The reported result: 11 seconds of load time saved in the TPS demo, described by the article as purely wasted time where the CPU ended up stalled doing nothing. As with the first case, that 11-second figure is team-reported for that demo, not a universal loading improvement.
What to take into your own project
Profile before changing anything, and distrust a symptom apparent location: the Polygon2D scene looked like an animation problem and turned out to be a mesh-lifetime problem.
Split the cost before judging it: only about 3.4 ms of an 11.7 ms drawing cost was actually rendering, and the rest was allocation churn.
Prefer not doing work over doing it faster: the fix removed a rebuild, and the heap fix removed waiting.
State the condition under which your fix holds: same vertex count means update in place, changed count means recreate.
Re-measure on the same scene and hardware, and report the numbers as yours or theirs, never as a general promise.
What this case does not prove
The 28 to 83 FPS result does not prove that every Godot 2D game will run three times faster. The measurement comes from one demo scene, on one CPU, for one technique.
The article does not state which Godot release the Polygon2D pull request shipped in, so this article makes no release-version claim.
The source article publishes no code listing, only profiler screenshots, so this article publishes no code and no transcribed snippet.
The 11-second shader figure is specific to the TPS demo and the D3D12 backend, not a claim about Vulkan, where SPIRV is used directly.
Sources and evidence notes
Sources: Thaddeus Crews, Optimizing CPU-side Rendering Code, Godot Engine official article, September 2026, godotengine.org/article/rendering-cpu-optimizations; Godot Engine documentation, CPU optimization, background on profilers only, no figures taken from it. All frame times, frame rates, and load-time figures in this article are as reported in the Godot official article for its demo scenes and hardware, and are attributed there in the text. No new benchmark, frame rate, code, or test result has been invented for this article. This article contains no affiliate links.
One String Length, Recalculated 63,000 Times: How t0st Cut GTA Online Loading by 70 Percent
One Missing Glyph Cost 16 MB: How Foxy Dumplings Cut Font Atlas Memory From 48 MB to 4-8 MB
Why Does My Godot Web Build Run in the Editor but Stop in the Browser?
Why Does My Godot Game Work in the Editor and Break in the Web Build?
This article contains no affiliate links. All timings and frame rates are attributed to their sources in the text; no new benchmark, frame rate, code, or test result has been invented for this article.